Author
ROC curves are a tool for evaluating model performance, not a model (they do not generate predictions or classifications). However they are interesting, important, and involved enough to constitute their own section.
Q3.1: What does an ‘ROC curve’ and ‘AUC’ stand for?
How does an ROC curve work, and what are the relevant formulas using TP and FP
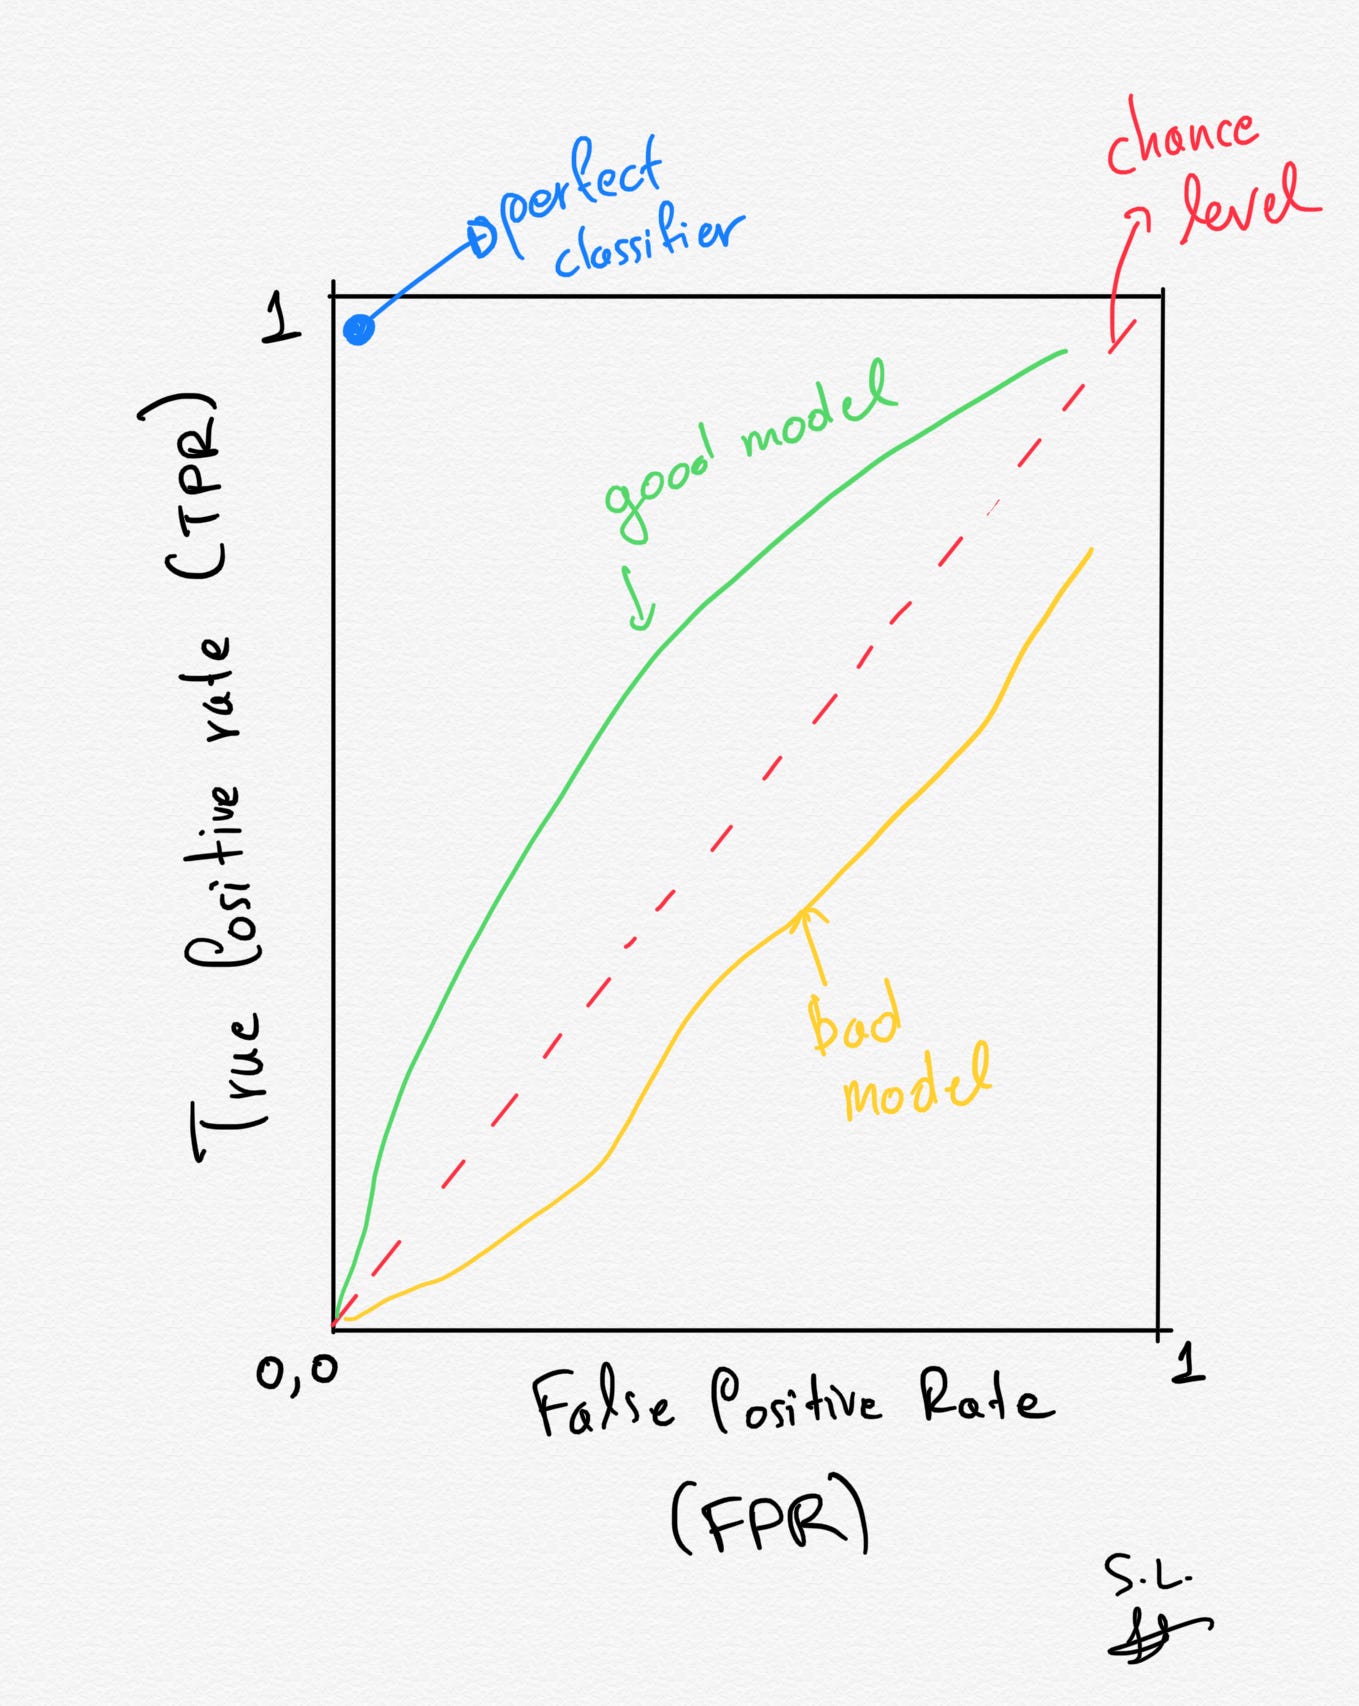
[Answer] An ROC (Receiver Operating Characteristic) curve is a graph that evaluates the performance of a binary classification model by plotting the True Positive Rate (TPR) against the False Positive Rate (FPR) at various thresholds. The relevant formulas are:
-
True Positive Rate (TPR): aka recall or sensitivity: how many of all the positives did you ‘catch’
-
False Positive Rate (FPR): *aka ‘1 - specificity’: how many of all the negatives did you ‘catch’ (the equivalent of recall but for true negatives)
The curve helps to quantify the model’s ability to discriminate between the positive and negative classes. A higher area under the ROC curve (AUC-ROC) indicates better model performance.
https://miro.medium.com/v2/resize:fit:1400/1*qW3Mobeew1xxnXJnBPy8LQ.jpeg draw the bad model curve too
Q3.2) How could we use an ROC curve to decide between using a random forest vs a logistic regression
In summary, they can be used to find better threshold and better entire models.
Q3.3) What type of model would theoretically produce the line on the ROC shown
Q3.4) What is the best threshold value to use in this example
- make it like a flat line thing, how this model is objectively better than this one.
- (sketch)
Q3.5) What is the relationship between the true positive rate and the false negative rate?
Reminder:
False negative rate = 1 - specificity
While sensitivity and 1-specificity are not mathematically dependent on each other in a direct equation, they are often inversely related in practice: improving one generally results in worsening the other, depending on the threshold chosen for classification.