Sampling… CSS on the question titles and . More sources: Robert’s tutes. bold wordscookbook
Q1) What is the fundamental principle of statistics?
getting philosophical, this can be extended to Data Science. Holistically, ChatGPT uses a sample (your prompt) to approximate the population value (the true best answer). A recommender system uses your profile data (the sample) to estimate the population value of the show you would theoretically like the most.
The diagram.
Inference is the heart of statistics, allowing us to deduce truths about a population using just a sample. While it may seem abstract, think of it as the art of making educated predictions from limited information. Whether estimating the percentage of blonde-haired individuals or predicting a stock’s value next week, inference empowers us to discern hidden patterns, make informed decisions, and even anticipate an individual’s preferences or whereabouts.
It’s the magic of drawing profound insights from mere fragments of data.
Inference is information, prediction, value, magic, secrets, power, knowing more than the other person despite having the same data, figuring out how to collect new data to serve your needs.
Inference means figuring out anything from: ‘what is the percentage of human beings with blonde hair’ to ‘how much more or less will this stock be worth next week?’ to ‘what is the likely sexuality of user 1234abcd? Which building are they likely to be in this weekend?’
Everything is a complex, beautiful extension of this simple diagram:
☞ First, must clarify Statistics vs Machine Learning. ML is rooted in concepts from statistics and probability. While many ML approaches extend beyond classic statistical techniques, making ML seem like a groundbreaking domain, the distinction between ML and statistics isn’t always clear-cut. In some scenarios, ML can be seen as an extension of age-old statistical methods rather than an entirely distinct discipline. Regardless of how we categorize it, ML often addresses analytical challenges that were previously tackled using traditional statistical methods. TL:DR There is a blurred lines and concepts/terminology can vary
Q2) What is the technical definition of a statistic?
☞ A statistic is a value computed from the sample data, so it can be thought of a ’function of the data’
E.g: for the data 5,4,6,9 the sample mean is a statistic because it is a function of the numbers; the function being the act of adding them all together and dividing by the number of them.
Q2) What assumptions should we try to uphold in our samples?
Randomness, Independence, Representativeness and Identically distributed
☞ Randomness simply means that every ‘unit’ in the population has an equal and independent chance of being included in the sample.
☞ Independent means that the selection of one sample does not influence the selection of another
☞ Representativeness: The sample should accurately reflect the characteristics of the entire population, ensuring the results from the sample can be generalized to the larger population
☞ Identically Distributed:“Identically distributed” means that all random variables in a set follow the same probability distribution. I.e is actually just an instance of larger population distribution given by .
Examples:
-
Tao is trying to take a random sample of all students at his school, Maillardet’s College\ ✻. If he only samples from the Year 12 building, clearly this is not a random sample because not every student had an equal chance of being selected; the year 4’s had near 0 probability because they’re strictly banned from going in the Year 12 building! As a result, Tao’s sample is likely to be biased; mainly representative of the Year 12’s instead of the whole school.
-
Let’s say Tao is quite a handsome guy. Whenever he selects any female to be a part of his sample, all females nearby flock to him, since they also want to be included. As a result, the sample is no longer independently distributed - since the selection of a female raises the probability of the next selection also being a female.
Q) Can you think of an example of a sample that is random but not representative?
- If Tao stands outside
Technically any random sample is representative for the underlying distribution; it’s really just a matter of whether we got the underlying distribution right. Just do a mental check of these main 3 things and you should be good. Randomness and representativeness True randomness is extremely difficult to obtain in practice - we need to cut corners
(Q) Hence, what are three things to test in order to confirm that a sample is a random sample?
- Random: Did each unit in the sample have an equal chance of being picked from the larger population?
- Independent: Does the value of a given sample unit affect the value of another sample unit?
- Identically Distributed: Does each unit being sampled come from the same underlying distribution? (This is proxy for representativeness)
Q3) For each of the following sampling scenarios, answer the following set of questions.
a) Do you think their sample is random? b) What is the population of interest? c) What assumptions are made and are they realistic?
Samantha conducts an aquatic experiment. She sets up ten aquariums, places an identical baby fish in each one, and keeps them under the same light conditions. After 8 weeks, she measures the length of each fish, yielding measurements .
- The assumption that the fish are identical is unrealistic
- The sample is
Molly measures the height of all of her immediate family members, giving measurements .
Considering that Molly’s immediate family likely consists of a combination of adults and children, their heights would not follow identical distributions. Additionally, due to their genetic connection, their heights might not be independent of each other. Thus, the data isn’t from a random sample. If the goal was to understand the height distribution of her family specifically, then she has captured the complete data, meaning it’s not a sample but the entire population. However, if she wanted to infer about the general height distribution of all humans, then this data would be a sample, but it wouldn’t be a representative or random one.
Q4) You want to estimate the number of trees infected with Ligmacitis in a 30,000 hectare forest. A) What could you theoretically do to get truly random sample, and B) What is a practical alternative?
A) To get a precise random sample, we would need to enumerate every tree (1, 2, 3, … ) and then use a random number generator to select a random subset of those numbers; and finally locate and inspect the trees. Clearly this is very impractical; you might as well take a census - check every single tree.
B) A practical sampling method is known as the ‘transect method’; you pick a random starting point, then pick a random bearing (angle), then walk in a straight line along this bearing and sample all trees within a certain distance (sometimes a physical rod is carried)
(diagram wld be sick, lil treasure map)
☞ Census: A complete enumeration of a population at a given time - you ‘sample’ the entire population.
☞ Reminder: in order for a sample from a real (finite) population to be random and representative, we aim to make sure that every member of the target population has an equal chance of being included in the sample.
Your statistical consulting company ‘SSS’ has been enlisted by the government, who wishes to determine the percentage of cars ‘on the road’ that are unregistered. Outline a practical sampling method to obtain a random sample.
Cluster sampling; choose a number of intersections across the region at random, and sample the cars that pass by at random. This could involve either:
- Testing every th car systematically
- Using a random number generator
QX) What is a Maximum Likelihood Estimator (MLE)
☞ The maximum likelihood estimator identifies the parameter value that maximizes the probability (likelihood) of observing the given data. While it comes from mathematics and statistics, it actually symbolises a much more important, abstract concept.
-
Estimates the population parameter , hence we add the ‘hat’
-
Is an Estimator, which means it’s a random variable (since it changes with the random data )
-
Bernoulli Example
-
Logistic regression Example
- The parameter changes the shape of the line
- We just have to find the parameter value that causes this line to ‘fit the data’ the best; specifically, results in the smallest SSE
-
Conceptual Example
Extra: what are the asymptotic properties of the MLE?
☞ Asymptotically = as
-
Asymptotically unbiased:
- Intuition: As the sample size grows indefinitely, the MLE’s expected value converges to the true parameter value.
- Proof: The bias of the MLE diminishes as the sample size increases, tending to zero in the limit.
-
Asymptotically efficient:
- Intuition: Among all consistent estimators, the MLE achieves the smallest possible variance in the limit as the sample size becomes infinitely large.
- Proof: In large samples, the MLE achieves the Cramér-Rao lower bound, making it the most efficient estimator.
-
Asymptotically normal:
- Intuition: For large samples, the distribution of the MLE approaches a normal distribution centered around the true parameter value, with a specific variance.
- Proof: With sufficiently large samples, the distribution of the MLE, when standardized, converges in distribution to a standard normal due to the Central Limit Theorem.
What’s stochastic?
Sufficient Statistics Question 10 ⚘⚘⚘
Imagine your friend Robert has a coin and he tells you that its probability of heads is . In a different room, he tosses the coin 10 times and records the result. Your job is to make the best guess about what the coin’s true probability of heads is, with the least amount of information. What do you ask him?
-
Of course, you could just ask him to show you the complete data
HHTHTTHHTH, but the point is only asking as much information as you need to make the best guess. -
Intuitively, you might be thinking: all I need to know is the number of heads out of 10.
-
This is correct; it is sufficient to know the total number of heads, , in order to make the optimal guess about .
- Notice how you intuitively don’t care about whether the first toss was heads or tails.
- This leftover information is still valid, but contributes nothing to your estimation.
- More technically, affects the total number of heads, but it does not affect where the heads occur.
- The conditional distribution of the whole sample being ordered the way it is, given that the total = , is independent of .
-
A statistic is sufficient for a population parameter if…
-
Note that it has to be sufficient FOR a partiuclar
In summary, the sufficient statistic uses all of the information in the sample relevant to the parameter of interest.
This is another example of a concept that appears in statistics but is conceptually applicable to many things, and it will can another dimension to the way you think about information in general.
☞ The sufficient statistic provides the essential information required to optimally estimate a desired parameter.
More holistically: sufficiency is important because the inclusion of extra, irrelevant information into our estimators (or models, in ML), just adds unnecessary variance. More unecessary noise throwing it off. Using things beyond the sufficient statistic will lead to a sub-optimal estimate, unwanted noise to sift through, and thus higher variance.
- An example from Statistics
Want to estimate
- An example from ML
Trying to predict whether someone has X using blood pressure, heart rate, gene X, favourite colour.
Clearly, it is sufficient to know the first 3 factors, while favourite colour is irrelevant.
Trying to include it in the model, and allowing the model to ‘learn’ on it will only decrease its accuracy, increase variance, and not contribute any information.
Reconstruct a sample
Follow up: Why is this concept important in data science?
If you’re trying to find the answer a question - e.g what percentage of my user base likes rock music - and don’t have the luxury of collecting unlimited data, it is important to know what information is actually relevant to your question of interest, so that you don’t waste time and resources collecting useless data.
Extra: Can you think of any machine learning context where sufficiency is used?
Certainly! The concept of sufficiency plays a vital role in the realm of statistics, and its applications in data science and machine learning are numerous. Here’s an example illustrating the use of the concept of sufficiency in the context of machine learning:
Example: Naive Bayes Classifier
Suppose we want to classify a set of text documents into different categories. Each document is represented by a feature vector, where each feature corresponds to the frequency of a particular word in the document.
Statistical Sufficiency in Naive Bayes:
When estimating the probabilities required for the Naive Bayes classifier, it’s not necessary to retain the entire dataset. Instead, for each class, we only need:
- The total number of documents belonging to that class.
- The total count of each word in documents of that class.
Given these two sets of counts, we can estimate all the required probabilities for the classifier. This is because the entire dataset’s information concerning the classification problem is encapsulated in these counts. In other words, these counts are a sufficient statistic for the problem at hand. Once we have these counts, the individual documents are no longer needed to estimate the probabilities or classify a new document.
Benefit in Data Science:
The concept of sufficiency in this context has practical implications:
-
Efficiency: We don’t need to store the entire dataset once we’ve computed the sufficient statistics. This can be a significant advantage, especially when dealing with massive datasets.
-
Privacy: By only storing aggregate counts, we avoid retaining individual data points, which can be beneficial for privacy concerns.
-
Scalability: Since we’re only updating counts when new data comes in, the Naive Bayes classifier can be easily scalable to large streaming datasets.
In this example, the principle of sufficiency helps simplify the problem, making the Naive Bayes classifier both computationally efficient and practically useful.
---
QX) What are 3 assumptions made in a linear regression model, and how do you test the validity of each of them?
- The data can be modelled linearly; i.e expected value of the response variable is a linear function of Check by visually inspecting the line of best fit on the data.
- Homoscedasticity (equal variances for all observation along the line) Plot fitted values on x-axis, and residuals on y-axis, should see no distinct pattern.
- The residuals are normally distributed Check with QQ plot of residuals
Homoscedacity, kurtosis etc.
a) as the true standard deviation of the points around the line reduces the estimated line becomes more accurate and vica versa
b) as the sample size increases the estimated line becomes more accurate
c) the estimated line tends to be closer to the real line in the middle of the observed data
d) roughly half the time the intercept is too high/low (follows exactly from its normal distribution and unbiasedness)
e) roughly half the time the slope is
too high/low (follows exactly from its normal distribution and unbiasedness) f) also fixing half
the xi at one end of the range and half at the other minimises the variability of the slope
(essentially by maximising K).
DIAGNOSE the following linear regression fits
A) ![[Pasted image 20231015193907.png | center | 500]] B) ![[Pasted image 20231015193940.png | center | 500]] C) ![[Pasted image 20231015193956.png | center | 500]]
QX) How can a simple linear model be adapted into a hypothesis test of association between two variables (phrase this with context).
Below is a linear fit of data comparing no. hours of jazz music listened to per week and IQ.
The null hypothesis becomes that the slope of the line of best fit is 0 (flat), i.e there is no linear relationship between the data.
Follow up: Lets say you conduct this hypothesis test and get a p-value of 0.042. At the 5% level of significance, what is your conclusion?
“Our p-value was 0.042 < 0.05, thus we reject the null hypothesis, and conclude that there is weak evidence of an association between no. hours of jazz music listened to per week and IQ.”
What is the concept of signal?
☞
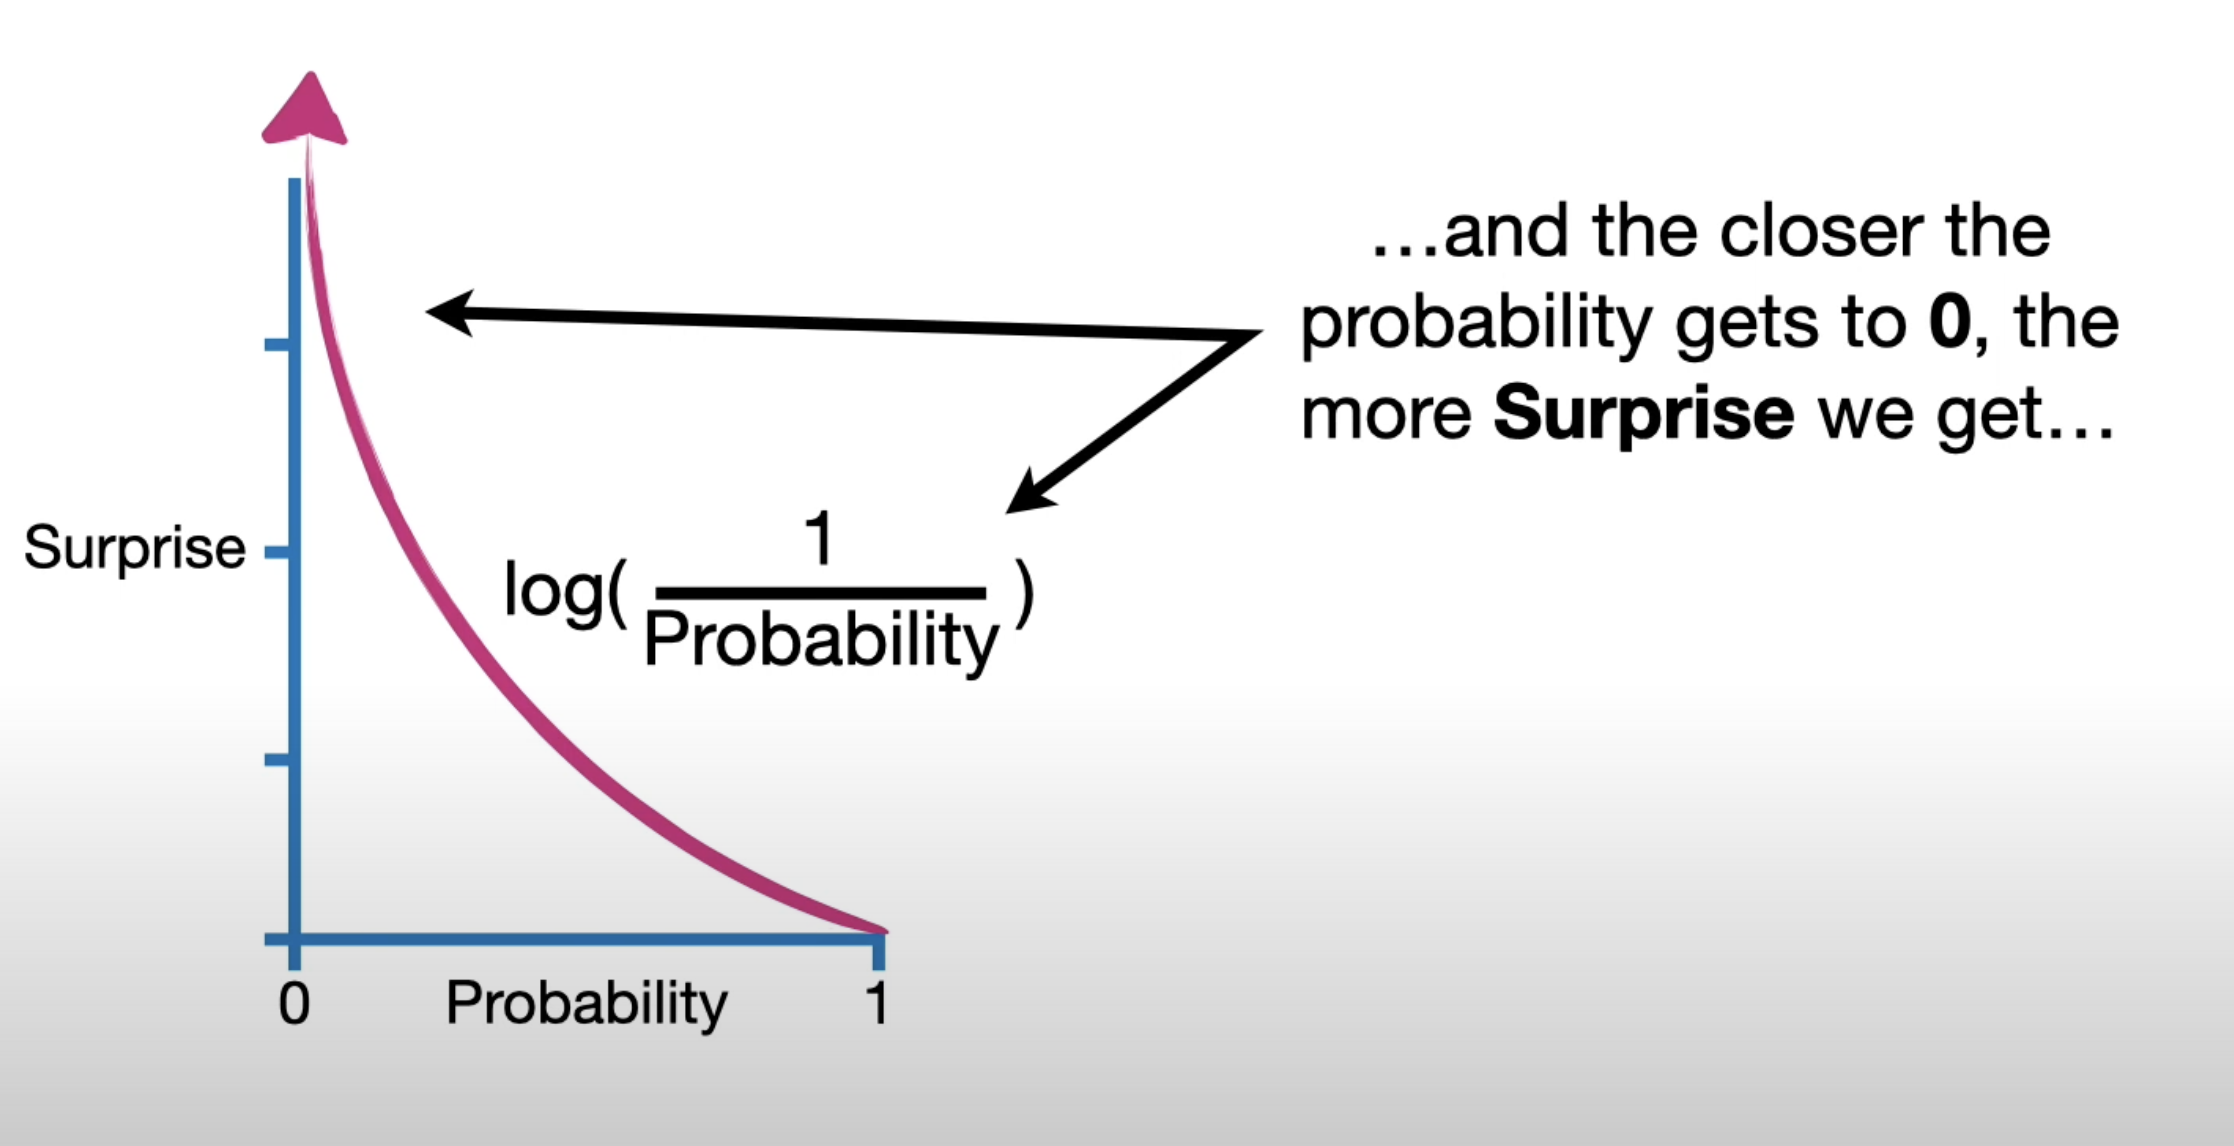
Follow up: What is ‘surprise’ in the context of probability?
Surprise
- Definition: Surprise or self-information of an outcome is a measure of how unexpected or surprising that outcome is, given its probability. It’s higher for less probable events and lower for more probable ones.
- Formula: The surprise of an event xx with probability P(x)P(x) is given by: I(x)=−log(P(x))I(x)=−log(P(x)) Here, loglog is typically the natural logarithm, making the unit of surprise ‘nats’. If the logarithm base 2 is used, the unit is ‘bits’.
- Interpretation: A highly improbable event (small P(x)P(x)) yields a high surprise value, whereas a very likely event (high P(x)P(x)) yields a low surprise value.
Consider the following diagram:
If we sampled one plant from this field, we would be very ‘surprised’ if it was a carrot there is a low probability of picking a carrot plant.
State the surprise formula. Why do we take the log?
- Taking the log means that a event with (such as the sun rising) results in surprise.
- If the probability is , then the surprise is still undefined.
- The properties of logs convert multiplication into addition when calculating total surprise
When calculating surprise for a binary/dichotomous outcome such as a coin toss, the convention is to use , as in .
Surprise is also known as ‘self information’ and basically quantifies how surprised you would be about something happening.
Surprise is best understood from its formula. Surprise is roughly the inverse of surprise: the less likely something is to happen, the more ‘surprised’ you are when it does.
It should be obvious to you why we take the log.
- The surprise is lower bounded to 0 (substitute a probability of 1 in and see).
- It also counteracts the decay of smaller probabilities.
- It allows us to convert the surprise of joint probabilities into sum, by log laws.
↳ Show me (with your hands) what a surprise/probability curve looks like.
Hint: try substituting in and .
###### ↳ Let's say your friend Robert gets you a prank coin for your birthday. It's biased, so lands on heads 80% of the time; $Pr(heads)=0.8$. What's the surprise associated with the following sequence of three coin tosses $[H, H, T]$ (in that order)?
The surprise associated with this is:
See how the log decomposes it into the sum of the surprises for the individual events?
↳ Let’s summarize the probability/surprise values for our biased coin. From this table, please calculate the expected surprise of a given coin toss,
| Heads | Tails | |
|---|---|---|
| Probability | 0.8 | 0.2 |
| Surprise | 0.3219 | 2.322 |
The working is the same as any calculation for expectation; you sum over all possible values of the random variable, weighted by the probability.
The general formula for is, then:
Where is an outcome of an event, with an associated probability and surprise.
↳ How is the expectation of surprise, , related to the concept of entropy?
The expected value of surprise is the definition of entropy - they are the same thing.
Note that you are more likely to see the formula for entropy in the following form, where the log is negative:
Are you familiar with entropy?
Entropy
Comes from information theory. Here are a few different interpretations:
- In general, it can be used a measure of uncertainty, impurity, disorder, diversity, or randomness.
- Statistics:
- the expected value of the surprise (as just seen above).
- can be thought of as the amount of information needed to specify a state.
- Machine Learning: in machine learning, entropy is a measure of impurity within a dataset. Go here to see its many uses in machine learning.
- Physics: Represents a measure of disorder, quantifying the level of unpredictability in the system (e.g a cup of tea) or dataset.
Entropy Formula
The formal definition of entropy in statistics and probability is:
The cool thing is that, to find the entropy of , all you need to do is substitute it in instead of :
↳ What is the entropy of a fair coin toss?
Entropy is highest when all outcomes are equally likely.
This is because you have zero information when it comes to predicting the outcome of the coin toss, since each ones are exactly equally likely.
If this doesn’t make sense, consider a biased coin with . here the entropy would be lower, indicating that there is less uncertainty about the outcome of the coin toss. Clearly, we have much more certainty that it will be heads rather than tails, whereas in the fair coin example, there was no certainty either way.
↳ What is the entropy of the event that I roll a number between and on a standard six-sided die.
.
You can think about this in two ways:
- Entropy is a measure of uncertainty, therefore an event which is certain to happen has 0 entropy. We are fully certain that it will happen.
- Substitute into the formula for entropy and see what happens.
↳ What is the entropy of the event that your favorite person eventually dies?
. Unfortunately, the universe is fully certain of it.
Death
- In the context of life, it’s a universally accepted fact that every living organism will eventually die, making the event of death a certainty with 100% probability.
One animal is selected at random from each of these pens. Which pen has the lowest entropy when it comes to the animal that ends up being picked?
What is mutual information? How is entropy related to it?
Mutual Information
Here are a few different interpretations:
- A measure of the amount of information knowing one variable provides about another.
- A measure of dependency between variables.
- A measure of relevance of one variable to another.
- A measure of the mutual dependence between two variables.
- It quantifies how much knowing one variable reduces uncertainty about another.
The best way to answer how it is related to entropy is by understanding the formula:
It is the reduction in entropy of by knowing the value of . A few more interesting things to know about mutual information:
- It is symmetric;
- It is not sensitive to scale, as it deals with distribution of probability instead of the values themselves.
- It can be used for multi-class or continuous variables; e.g the mutual information between the color of a car (categorical) and its speed (continuous, but may require binning).
- It can capture all relationships including non-linear.
###### ↳ How do you actually calculate mutual information from real data?
(statquest)
This is mathematically equivalent formula:
↳ Is mutual information symmetric?
Yes, it is symmetric. Remember - it is a measure of the mutual dependence between two variables. Mathematically;
↳ Can mutual information be negative? Why or why not?
It cannot be negative, but it can be zero. Looking at the formula, , the mutual information could only be negative if .
But this impossible, since the added information from knowing the value must decrease the entropy (uncertainty).
Unless of course, and are independent - in this case and the mutual information is zero. This is intuitive; if the variables are independent, then you gain information about from knowing and vice versa.
What is cross entropy?
A type of loss function
Cross entropy
- Cross-entropy is a measure of the difference between two probability distributions for a given random variable or set of events.
- Despite its very statistical-sounding definition, it can be used for
- Used in image classification as a loss function, in conjuction with an optimizer like adam optimization.
- Used in decision trees (link)
- How does it work?
- In machine learning/deep learning, the ‘probability disitribution’ becomes an empirical frequency count
\text{Cross Entropy} = -\sum_{x} T(x) \log_2 P(x)